Activate the Visual Studio Remote Debugging Monitor
The following steps are used for initiating the Visual Studio remote debugging monitor on your SharePoint web front end server so that a connection may be established between it and your instance of Visual Studio (which will, of course, be located on your workstation):
- Log on to your web front end server
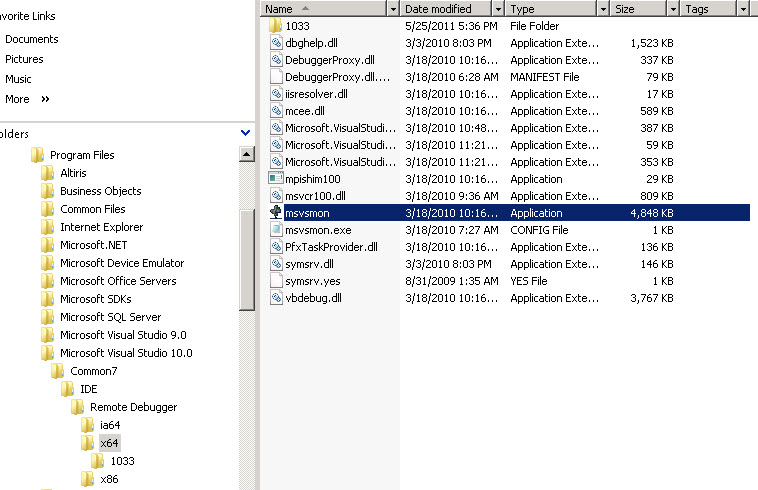
- Open Windows Explorer and navigate to the following directory: C:\Program Files\Microsoft Visual Studio 10.0\Common7\IDE\Remote Debugger
- If the directory doesn't exist on the server, you can obtain a copy of it from the laptop or desktop upon which Visual Studio 2010 is installed
- Once you're in the Remote Debugger directory, double click on the appropriate directory name based on the processor of your web front end server (i.e. x64 is most likely what you'll choose if you're working with SharePoint 2010)
- Double click on the msvsmon file
- Copy the name of the new server that is started as you'll be using it later when you're ready to attach Visual Studio to your process. This will be the string that is contained in the Description field as follows: Msvsmon started a new server name 'CopyThisName'. Waiting...

Deploy Your Assembly and Debug Files to the BIN Directory
If you're solution is currently deployed to the Global Assembly Cache (GAC), you're going to need to temporarily change gears and deploy to your web application's BIN directory due to the fact that the Global Assembly Cache doesn't support .pdb files. Here the steps you can perform to temporarily change your deployment to the BIN directory:
- On your SharePoint web front end server, open Windows Explorer and navigate to your SharePoint web application's directory (C:\inetpub\wwwroot\wss\virtual directories\webapplicationname)
- Locate the bin directory and copy all of your SharePoint site's assembly and debug (.dll and .pdb) files into it
- Save off a backup copy of your web.config file
- Using Notepad, open the web application's web.config file
- Locate the <trust> element
- Temporarily set the level attribute to read "Full" (i.e. <trust level="Full" originUrl="" />).
Next, you will need to remove your SharePoint site's .dll files from the GAC via the following steps:
- Using Windows Explorer, navigate to C:\Windows\Assembly
- Locate the first .dll file associated with your SharePoint site
- Right-click on the file and select Uninstall
- Repeat steps# 2 and 3 for each assembly until all of your SharePoint site .dll files have been removed
- In order for the change to take effect, you will need to reset IIS by opening a command prompt and typing "iisreset"
Obtain the Worker Process ID
The following steps of the process will allow you to (1) verify that your deployment to the bin directory was successful and (2) to launch the worker process that you will be attaching to:
- On your workstation, open your web browser and navigate to your SharePoint site
- Verify that your site is functioning as expected (this also has the added bonus waking up the SharePoint worker process)
- On your SharePoint web front end server, open a command prompt
- Type "cd c:\windows\system32\inetsrv"
- Type "appcmd list wp"
- Identify the appropriate worker process that is associated with the application pool of your SharePoint site
- Take note of the ID that is associated with that worker process which will be the numeric value in quotes (i.e.WP "724" (applicationPool:SharePoint - MySharePointSite80))
Attach Visual Studio to the Worker Process
These final step of the process will now allow you to connect your instance of Visual Studio with the remote debugging monitor so that you will, at last, be able to step through the C# code of your SharePoint components:

- On your workstation, open Visual Studio
- Open your SharePoint site's code solution file
- Once your solution is loaded, open the appropriate .cs file you wish to debug and place your breakpoint(s)
- Click Debug -> Attach to Process...
- For Qualifier, update the textbox with the remote debugging server name that you captured in Step# 6 of the Activate the Visual Studio Remote Debugging Monitor section
- Select the w3wp.exe process that matches the ID that you recorded in Step# 7 of the Obtain the Worker Process ID section
- Click the Attach button

At this point, you will now be able to debug your SharePoint site's C# code as you would any other type of solution. Wish you the best with your debug efforts and may you squash that bug quickly!
No comments:
Post a Comment
Note: Only a member of this blog may post a comment.